Business Credit Demand lifts moderately 2.1%
Veda Quarterly Business Credit Demand Index: March 2014
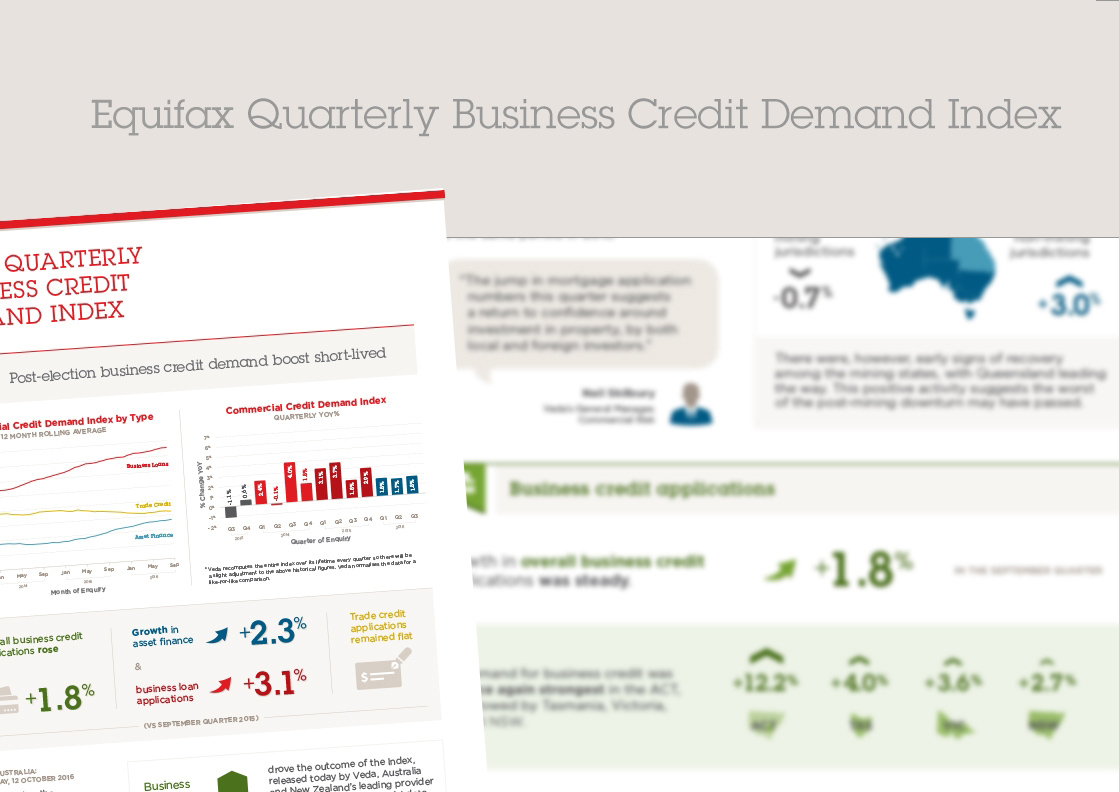
Business Credit Demand lifts moderately 2.1%, with Business Loan Demand fuelled by 18% growth in Commercial Mortgage Growth
- Moderate lift in business credit demand to 2.1% for the March quarter (vs March quarter 2013), but mining states show sustained weakness
- Business Loans grew by 4.2% on the back of commercial mortgage volumes growing at 18% for the March quarter (vs March quarter 2013)
- Asset finance shows signs of recovery in March quarter after significant falls in the first half of fiscal 2013
Sydney, Australia: 15 April 2014 – The Veda Quarterly Business Credit Demand Index, measuring applications for business loans, trade credit and asset finance rose 2.1% in the March 2014 quarter.
The increase in overall business credit applications over the past year is a result of rises in business loan applications (+4.2%) and trade credit applications (+1.9%), partially offset by a small decline in asset finance applications (-0.2%).
Overall business credit applications across the non-mining states rose 3.5% in the March quarter. Business credit applications have been weaker across the mining states (WA, QLD and NT), with applications contracting at an annual rate of 0.6% in the March quarter. WA was the only state where overall business credit applications fell over the year (-6.8%).
Overall, the Veda Quarterly Business Credit Demand Index (business loans, trade credit and asset finance) has reached its highest level this fiscal year, rising 2.1% in March 2014; compared to 0.9% growth the previous quarter.
Activity in the property market has driven a surge in commercial mortgage applications, contributing to a 4.2% growth in overall business loan applications (mortgage applications, lending proposals, premium finance and credit cards). The quarter saw a 18% rise in commercial mortgage applications, as low interest rates drove significant demand in SME lending.
Reflecting the downturn in mining construction activity, WA experienced a sharp contraction in business loan applications (-9.0%). Other states performed strongly, particularly NSW (+8.5%), followed by QLD (+6.5%), ACT (+5.1%), VIC (+4.2%), SA (+2.6%) and NT (+2.5%). In terms of other industries, contractions were also seen in utilities and transport.
Veda’s General Manager Commercial Credit, Moses Samaha, said: “Business loan applications fell in the mining industry over the past year. They also declined in the utilities and transport industries. In contrast, business loan applications have increased over the past year in the property services industry, reflecting the strength being seen in mortgage applications.”
“Veda’s Quarterly Business Credit Demand Index gives a particularly good indication of what’s happening at the SME level. The growth in commercial mortgage applications shows the same factors that are driving consumer credit demand – such as low interest rates – are driving SME interest in property,” Mr Samaha said.
Asset finance is showing signs of recovery, with the rate of contraction slowing to -0.2% in March quarter against -3.1% in the December quarter, following significant falls between the June and September quarters in 2013 (+5.9% to -4.7%).
Within asset finance, hire purchase (-6.7%) and personal loan applications (-7.4%) have been weak, while commercial rental (+11.6%) and leasing applications (+6.5%) have shown positive growth over the past year.
NSW (+7.5%) experienced the strongest growth in asset finance applications. The mining states continued to show weakness, with WA (-10.9%), QLD (-5.2%) and NT (-1.3%) all showing contractions. VIC (+0.1%), SA (-3.4%), TAS (-0.8%), and the ACT (-3.3%) are also showing weak asset finance application levels.
Overall growth in trade credit applications picked up in the March quarter to 1.9%. Positive growth in trade credit was seen in NSW (+2.7%), QLD (+5.5%), TAS (+5.6%), and NT (+13.5%). In contrast, VIC (-0.4%), SA (-0.1%), WA (-2.0%), and the ACT (-0.6%) experienced modest falls.
Trade credit applications growth over the year to March reflects strength in 30 day accounts (+3.8%) and 7 day accounts (+23.5%). Trade credit applications increased over the past year in the mining industry, as well as in the utilities, wholesale trade, and retail trade industries.
The Veda Business Credit Demand Index has historically proven to be a lead indicator of how the overall economy is performing.
Given the historical relationship between the Veda Business Credit Demand Index and growth in real GDP, Veda’s latest business credit data would indicate growth in the Australian economy continuing to remain below trend in early 2014, at a rate similar to the 2.8% recorded in the year to the December quarter of 2013.
NOTE TO EDITORS
The Veda Quarterly Business Credit Demand Index measures the volume of credit applications that go through the Veda Commercial Bureau by credit providers such as financial institutions and major corporations in Australia. Based on this it is a good measure of intentions to acquire credit by businesses. This differs to other market measures published by the RBA/ABS, which measure new and cumulative dollar amounts that are actually approved by financial institutions.
DISCLAIMER
Purpose of Veda Indices releases: Veda Indices releases are intended as a contemporary contribution to data and commentary in relation to credit activity in the Australian economy. The information in this release does not constitute legal, accounting or other professional financial advice. The information may change and Veda does not guarantee its currency, accuracy or completeness, and you should rely on your own analysis and applications. Veda has relied on third party information in compiling the Indices and has not been able to independently verify the accuracy of that information. To the extent permitted by law, Veda specifically excludes all liability or responsibility for any loss or damage arising out of reliance on information in this release and the data in this report, including any consequential or indirect loss, loss of profit, loss of revenue or loss of business opportunity