Consumer Credit Demand Index highest since 2008: Mortgage Demand maintains relative strength
Veda Quarterly Business Credit Demand Index: March 2014
Veda Quarterly Consumer Credit Demand Index at highest level since 2008: Mortgage Demand maintains relative strength
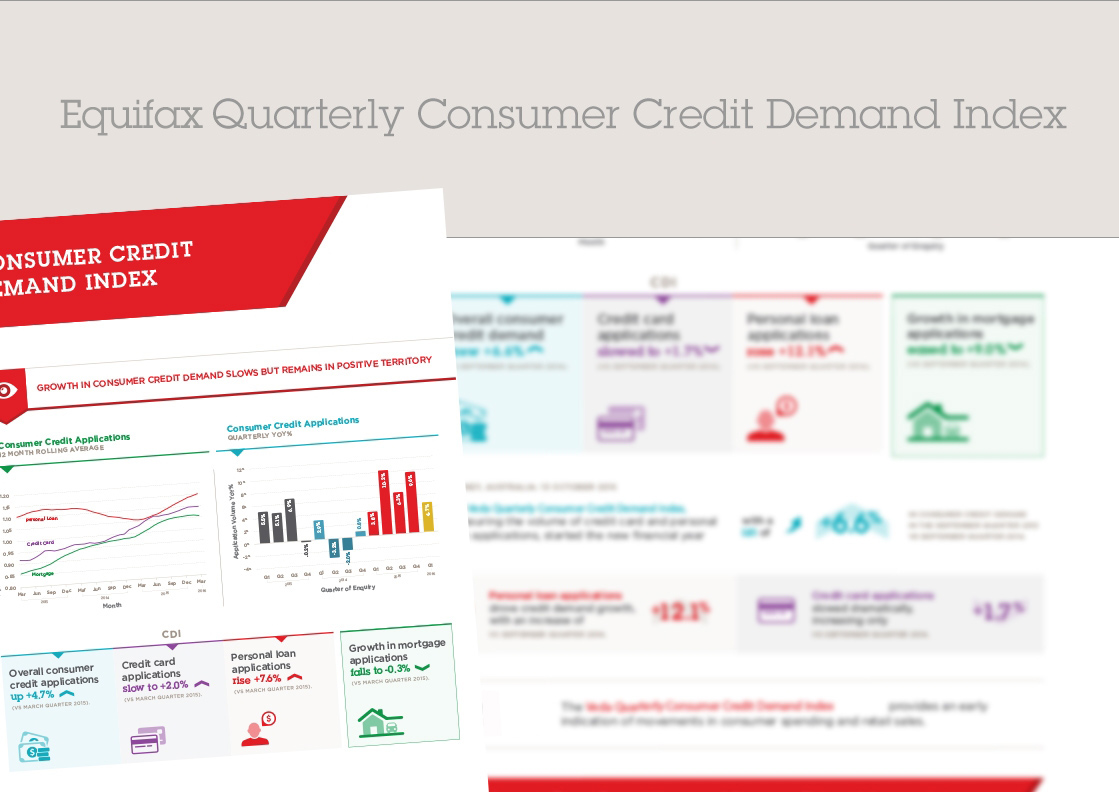
- Overall consumer credit demand lifts to 3.1% for the March quarter (vs March quarter 2013)
- Credit card applications up 6.4% on 2013 March quarter
- Personal loan applications flat on 2013 March quarter
- Mortgage demand up 10.8% for March the quarter (vs March quarter 2013)
Sydney, Australia: 9 April 2014: The Veda Quarterly Consumer Credit Demand Index, measuring applications for credit cards and personal loans, picked up to an annual rate of 3.1% in the March quarter, rising from a flat outcome recorded in the December 2013 quarter.
Credit demand in the March quarter was the strongest recorded for the index since June 2008 (looking at overall volume for credit cards and personal loans). The result this quarter was carried by healthy January and February figures, with a noticeable easing in the month of March.
Released today, the Veda Quarterly Consumer Credit Demand Index provides an early indication of movements in consumer spending and retail sales.
“Credit Demand in the March quarter is typically strong, following the seasonal peak in spending and borrowing associated with Christmas trading. Certainly this was the case with January and February eclipsing demand for the same months in 2013,” said Angus Luffman, Veda’s General Manager of Consumer Risk.
“However, we saw a definite softening of demand in March. This aligned with movements in consumer sentiment indices over the quarter and would indicate the outlook for the June quarter is not as strong as we’ve seen more recently.”
Credit card applications are showing sustained growth, rising 6.4% in the March quarter, up from 2.1% in December. Applications rose in all states except WA, where they were relatively flat (+2.2%) and the ACT where they eased (+4.5%). Strongest growth was in VIC (+9.4%) and NT (+9.8%), followed by QLD (+7.7%), SA (+7.2%), TAS (+5.7%) and NSW (+4.7).
“The March quarter was the fourth consecutive quarter of growth for credit card applications, after two years of weakness. Increased marketing activity by major lenders drove the higher applications. While this activity will also result in a level of customer churn, the number of cards on issue and total credit outstanding (RBA lending and credit aggregates), has grown in the past year. This shows there is continuing growth available in the credit card market after a sustained period of decline over 2011 and 2012,” Mr Luffman said.
In contrast, personal loan applications have been flat over the last three quarters. Nationally, personal loan applications rose just 0.1% in the March quarter, up from a fall of 1.5% recorded in the December quarter.
NSW (+1.4%) and the NT (+4.2%) were the only states showing growth in personal loan applications for the March quarter, while QLD (+0.1%) and VIC (-0.1%) saw flat levels of applications. Personal loan applications fell in the quarter in SA (-0.4%), WA (-2.5%), TAS (-2.4%) and the ACT (-0.4%).
“We have seen two and a half years of sustained growth in personal loan applications since 2011. These have held up well in recent quarters, despite the fact that one of the key drivers of growth, new car sales, is presently declining.
Low interest rates are powering a recovery in the housing market. Mortgage demand continued to grow at double-digit rates to 10.8% over the year to March, although the pace of growth cooled slightly from the December quarter (+14.8%).
The Eastern states led the way in the March quarter, with mortgage applications mirroring intense housing market growth in capital cities, particularly Sydney. Mortgage demand was strongest in NSW (+19.0%), followed by TAS (+13.9%), QLD (+10.5%) and VIC (+10.4%); and far weaker in WA (+1.1%), the NT (+3.2%) and the ACT (+2.7%), with SA (-0.1%) the only state with negative growth.
Historically, movements in Veda mortgage demand have tended to lead movements in house prices by around six to nine months, with mortgage applications a good predictor of home buyer demand and an excellent indicator of housing turnover.
“The growth in mortgage demand, exhibited since late 2012, is now playing out as growth in the RBA aggregates, both in the stock of housing credit and new housing finance commitments,” Mr Luffman said.
“However the pace of growth in mortgage applications is something to keep an eye on, as it eased in all states except the NT and TAS in the March quarter. Mortgage applications growth in WA (+1.1%) fell sharply from growth of 11.2% in the December quarter, which may be an early sign that the Perth housing market is set to cool in the months ahead.
“The Reserve Bank’s hold on interest rates has supported share market gains and higher housing prices, providing a boost to household wealth and freeing up disposable income. This has offset a weak labour market and a rising unemployment rate of 6.0% in February – a drag on disposable income growth, which could point to a weakening in demand for credit.”
NOTE TO EDITORS
The Veda Quarterly Consumer Credit Demand Index measures the volume of credit card and personal loan applications that go through the Veda Consumer Credit Bureau by financial services credit providers in Australia. Credit applications represent an intention by consumers to acquire credit and in turn spend; therefore the index is a lead indicator. This differs to other market measures published by the RBA which measure credit provided by financial institutions (i.e. balances outstanding).
DISCLAIMER
Purpose of Veda Indices releases: Veda Indices releases are intended as a contemporary contribution to data and commentary in relation to credit activity in the Australian economy. The information in this release does not constitute legal, accounting or other professional financial advice. The information may change and Veda does not guarantee its currency, accuracy or completeness, and you should rely on your own analysis and enquiries. Veda has relied on third party information in compiling the Indices and has not been able to independently verify the accuracy of that information. To the extent permitted by law, Veda specifically excludes all liability or responsibility for any loss or damage arising out of reliance on information in this release and the data in this report, including any consequential or indirect loss, loss of profit, loss of revenue or loss of business opportunity