Personal loans drive strong growth in consumer credit demand
Veda Quarterly Consumer Credit Demand Index: December 2015 Quarter
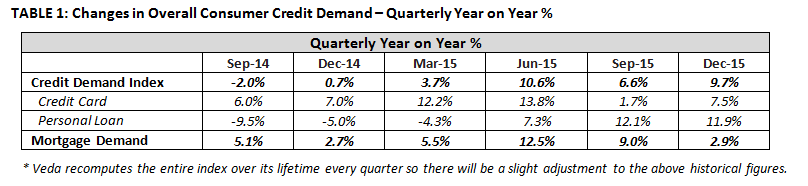
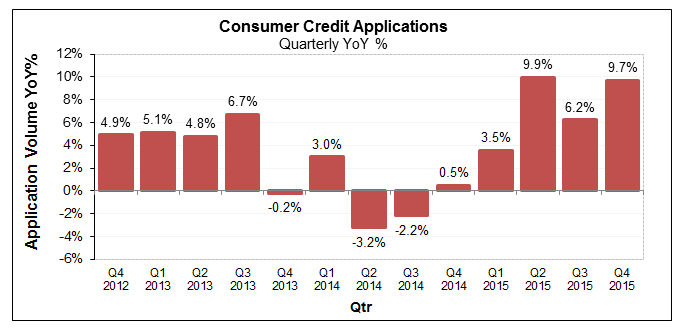
- Overall consumer credit applications up +9.7% (vs December quarter 2014)
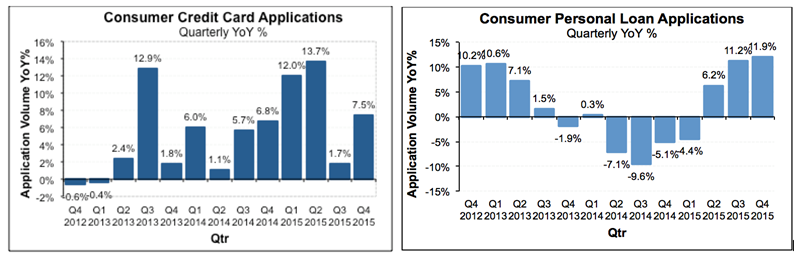
o Growth in credit card applications steady at +7.5% (vs December quarter 2014)
o Personal loan applications rise +11.9% (vs December quarter 2014) -
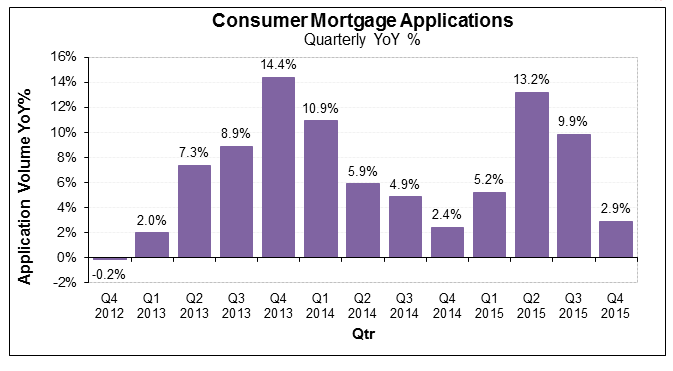
Growth in mortgage applications eases to +2.9% (vs December quarter 2014)
Sydney, Australia: 28 January 2016 – Released today, the Veda Quarterly Consumer Credit Demand Index, measuring the volume of credit card and personal loan applications, showed a 9.7% lift in consumer credit demand in the December quarter compared with the same period in 2014.
Overall consumer credit application growth was driven by an increase in credit card applications up from 1.7% in the September quarter to 7.5% in the December quarter, and continued strength in personal loan applications, up 11.9% in the December quarter.
The Veda Quarterly Consumer Credit Demand Index provides an early indication of movements in consumer spending and retail sales.
Angus Luffman, Veda’s General Manager of Consumer Risk, said the growth in demand for personal loans, building on positive results from the previous quarter, could be attributed to several factors.
“Despite the challenges posed by the downturn in mining-related construction, retail spending has remained robust due to low interest rates settings, a strengthening jobs market and rising consumer sentiment late last year.
“Auto finance applications, in particular, have experienced an upswing, with car sales rising by 6.0% over the year to November 2015, helping drive the growth in personal loan applications,” Mr Luffman said.
“Another trend carrying through from the previous quarter is the proportion of new personal loan applications coming from alternative lenders.
“Interestingly, the quality of applicants approaching non-traditional finance providers has been steadily improving over the past two years, as evidenced by the increase in applicants’ average credit scores, or Equifax Scores. The average age of borrowers using alternative lenders is creeping up as these lenders shift from being primarily a channel for younger consumers. The age of applicants is now on par with the market average.
“It’s still early but, if this trend continues, it may be an indication that alternative lenders are becoming a more mainstream option for borrowers,” Mr Luffman added.
Veda’s latest mortgage application data shows a second consecutive quarter of significant decrease in growth in mortgage applications, which slowed to just 2.9% in the December quarter. The slowdown in mortgage application growth was sharpest in NSW, and could be seen in all jurisdictions except the NT.
“The fall in mortgage applications suggests cooling conditions in the housing market heading into 2016, especially in light of the Australian Prudential Regulation Authority’s (APRA’s) changes to investment lending. It also suggests less support for retail spending from the housing market in the months ahead,” Mr Luffman said.
Growth in credit card applications improved slightly in the December quarter (+7.5%) compared to December 2014. The strongest growth in credit card applications in the December quarter was in WA (+9.9%), followed by NSW (+9.6%), ACT (+9.5%), SA (+8.2%), NT (+6.5%), Tasmania (+6.2%), Queensland (+5.6%), and Victoria (+5.0%).
Growth in personal loan applications remained strong in the December quarter. Strong growth in personal loan applications was seen in Tasmania (+18.6%), Queensland (+13.5%), NSW (+11.8%), Victoria (+11.6%), WA (+10.5%), SA (+9.8%), NT (+9.7%), ACT (+4.7%).
Strong growth in household goods retailing late last year and improving growth in car sales are both consistent with the stronger growth being seen in personal loan applications.
Demand for mortgages cooled significantly in the December quarter. Mortgage applications growth slowed in all jurisdictions except the NT in the December quarter, with the sharpest slowdown seen in NSW. The annual rate of growth in mortgage applications was strongest in Victoria (+7.7%), followed by NSW (+5.4%), SA (4.7%), the ACT (+2.9%), and Queensland (+1.6%). WA (-10.1%), Tasmania (-11.0%) and the NT (-14.6%) have seen a fall in mortgage applications over the past year.
Historically, movements in Veda mortgage applications have tended to lead movements in house prices by around six to nine months, with mortgage applications a good indicator of home buyer demand, and an excellent indicator of housing turnover.
The slowing demand for mortgages is consistent with other recent indications of cooling in the housing market, including falling auction clearance rates and a fall in house prices in November and December. The index has been trending to support a softer housing market after the most recent mortgage demand peak in June 2015. The latest data suggests more subdued housing market conditions heading into 2016.
NOTE TO EDITORS
The Veda Quarterly Consumer Credit Demand Index measures the volume of credit card and personal loan applications that go through the Veda Consumer Credit Bureau by financial services credit providers in Australia. Credit applications represent an intention by consumers to acquire credit and in turn spend; therefore the index is a lead indicator. This differs to other market measures published by the RBA which measure credit provided by financial institutions (i.e. balances outstanding).
DISCLAIMER
Purpose of Veda media releases: Veda Indices releases are intended as a contemporary contribution to data and commentary in relation to credit activity in the Australian economy. The information in this release is general in nature, is not intended to provide guidance or commentary as to Veda’s financial position and does not constitute legal, accounting or other financial advice. To the extent permitted by law, Veda provides no representations, undertakings or warranties concerning the accuracy, completeness or up-to-date nature of the information provided, and specifically excludes all liability or responsibility for any loss or damage arising out of reliance on information in this release including any consequential or indirect loss, loss of profit, loss of revenue or loss of business opportunity.