Strongest growth in credit card demand in almost a decade
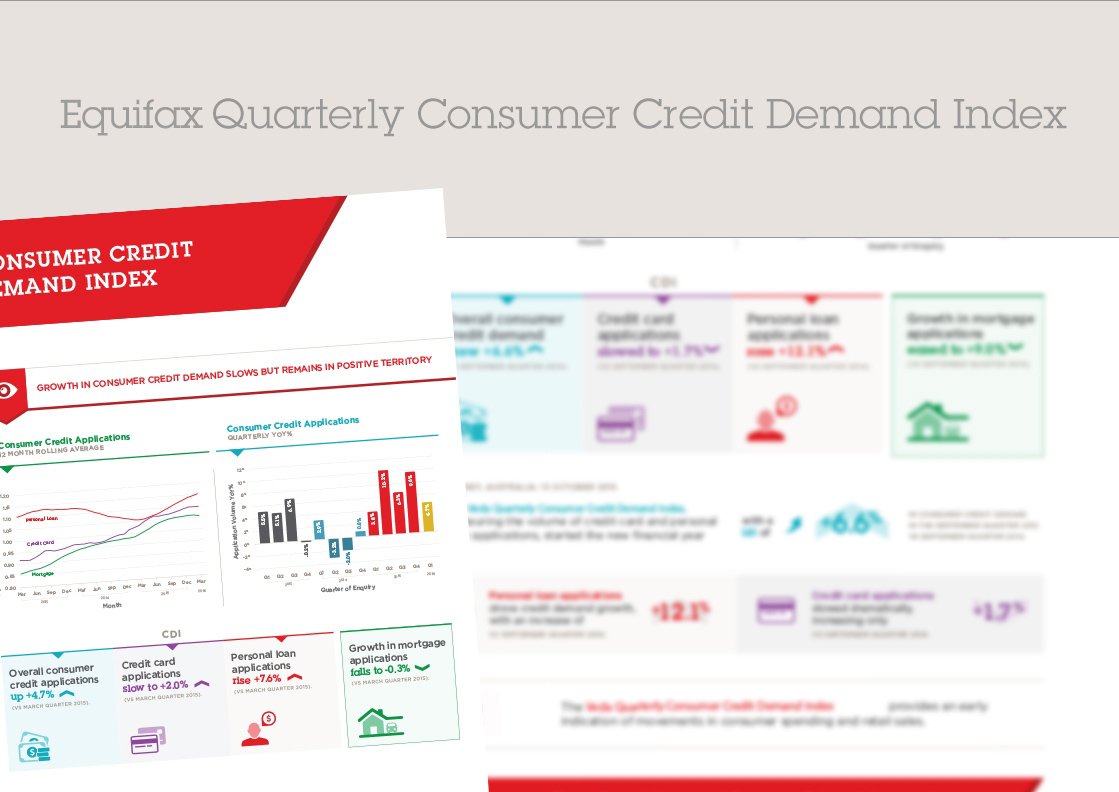
Veda Quarterly Consumer Credit Demand Index: March 2015
- Overall consumer credit demand grew +3.9% (vs March quarter 2014)
o Credit card applications up +13.5% (vs March quarter 2014)
o Personal loan applications down -5.2% (vs March quarter 2014)
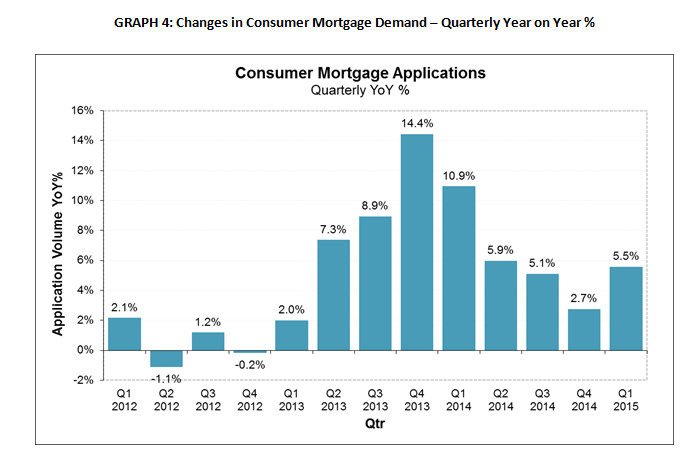
- Growth in mortgage applications picked up nationally to +5.5% (vs March quarter 2014)
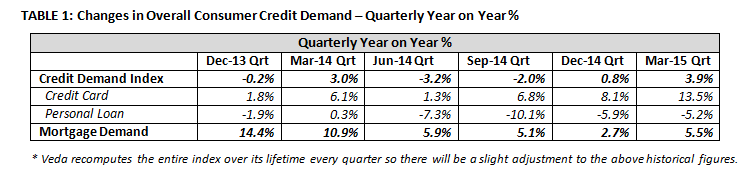
Sydney, Australia: 22 April 2015 – The Veda Quarterly Consumer Credit Demand Index, which measures the volume of credit card and personal loan applications processed through Veda’s Consumer Credit Bureau, saw a lift in consumer credit demand in the March quarter, with annual growth of 3.9% compared with the same period last year.
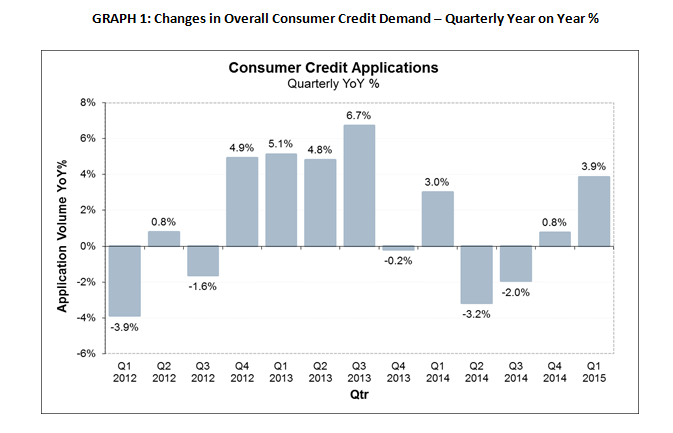
Demand for credit cards, up +13.5% for the quarter, was offset by a -5.2% contraction in demand for personal loans compared with the March quarter 2014.
The March quarter experienced the strongest growth in credit card demand since 2006. Angus Luffman, Veda’s General Manager of Consumer Risk, said the high demand for credit cards was being driven by two main factors.
The first factor was strong marketing activity by the major card issuers which continued to drive churn in the market.
“It’s important to put the 13.5% increase in credit card applications in the context of RBA’s latest data. This reported that while the number of purchases per account grew by 7%, the average spend per transaction declined by 2.9% and credit card balances grew at a modest annual rate of 1.6% in the December quarter 2014 compared with the same period in 2013,” Mr Luffman said.
“This indicates an emerging trend in the changing nature of credit card use. Credit cards are increasingly being used as payment tools, with people making repayments on existing purchases instead of using them for new borrowing.”
Mr Luffman went on to say the second factor contributing to the increase in credit card applications was an improved level of consumer sentiment in the quarter.
“Consumer sentiment lifted following the Reserve Bank’s cut to the cash rate, and ended the quarter at around its long term average despite some weakness in the labour market.
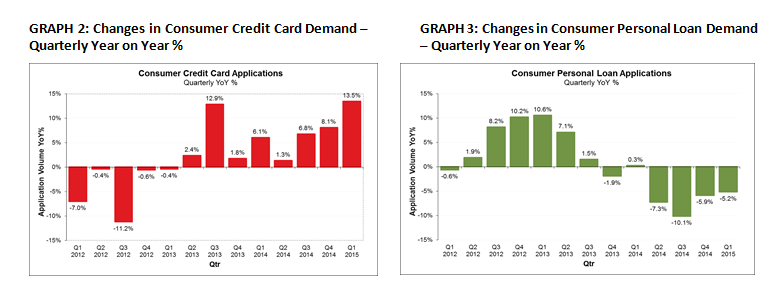
“In the same period we experienced a mild improvement in personal loan applications, which declined at -5.2% in the March quarter versus -5.9% in the December quarter 2014. This is likely linked to improved consumer sentiment translating to household goods purchases and spending on larger items. Any return to growth is likely to be linked to growth in vehicle purchases.” Mr Luffman said.
Released today, the Veda Quarterly Consumer Credit Demand Index provides an early indication of movements in consumer spending and retail sales.
Growth in credit card applications was up +13.5% in the March quarter. Application numbers lifted significantly across all states and territories. Tasmania (+20.2%), SA (+16.9%), WA (+15.7%), experienced the strongest growth, followed by NT (+14.3%), Victoria (+13.7%), ACT (+13.3%), NSW (+12.6%) and Queensland (+12.0%).
Personal loan applications continued to decline nationally, falling -5.2% in the March quarter, however the pace of decline has eased (-5.9% in December 2014 quarter). An improvement in the pace of decline was seen in NSW (-6.4%), WA (-7.7%), the NT (-4.6%) and Queensland (-2.3%). Further deterioration in personal loan applications was seen in the ACT (-9.6%) Victoria (-5.4%), SA (-4.3%), and Tasmania (-2.7%).
Mortgage application growth picked up for the first time in twelve months in the March quarter. The annual rate of growth in mortgage applications picked up from 2.7% in the December quarter to 5.5% in the March quarter. Despite this rise in mortgage applications, the annual rate of growth is still well down on the peak of 14.4% recorded in the December quarter 2013.
Mortgage applications are not part of the Consumer Credit Demand Index, but are a good lead indicator of future activity in home buyer demand and housing turnover. Historically, movements in Veda mortgage demand have tended to lead movements in house prices by around six to nine months. This continues to be backed up by the data, with the slowdown in the annual growth rate in Veda mortgage applications, first observed in the March quarter 2014, later reflected in an easing in the annual rate of house price growth from the June and September quarters 2014 across most markets.
NSW (+10.5%), the ACT (+9.6%) and Victoria (+6.6%), all experienced a strong pick up in mortgage applications in the March quarter, while SA (+3.3%), Queensland (+2.8%) and Tasmania (+0.1%) also saw increases. Mortgage application growth eased in the NT (-5.5%) and WA (-3.2%).
Despite starting out slowly in January, mortgage applications saw an improved rate of growth in the March quarter, suggesting demand in the housing market remains strong.
“The Reserve Bank’s decision to cut interest rates in February seems to have reignited mortgage application demand. The trend of easing growth rate of mortgage applications seen over the past 12 months has been broken this quarter, a trend particularly evident in the second half of the quarter.
“However it is too early to tell whether this growth signals a turning point that will be sustained over the coming months,” Mr Luffman said.
NOTE TO EDITORS
The Veda Quarterly Business Credit Demand Index measures the volume of credit applications that go through the Veda Commercial Bureau by credit providers such as financial institutions and major corporations in Australia. Based on this it is a good measure of intentions to acquire credit by businesses. This differs to other market measures published by the RBA/ABS, which measure new and cumulative dollar amounts that are actually approved by financial institutions.
DISCLAIMER
Purpose of Veda media releases: Veda Indices releases are intended as a contemporary contribution to data and commentary in relation to credit activity in the Australian economy. The information in this release is general in nature, is not intended to provide guidance or commentary as to Veda’s financial position and does not constitute legal, accounting or other financial advice. To the extent permitted by law, Veda provides no representations, undertakings or warranties concerning the accuracy, completeness or up-to-date nature of the information provided, and specifically excludes all liability or responsibility for any loss or damage arising out of reliance on information in this release including any consequential or indirect loss, loss of profit, loss of revenue or loss of business opportunity.